Bitcoin - correction
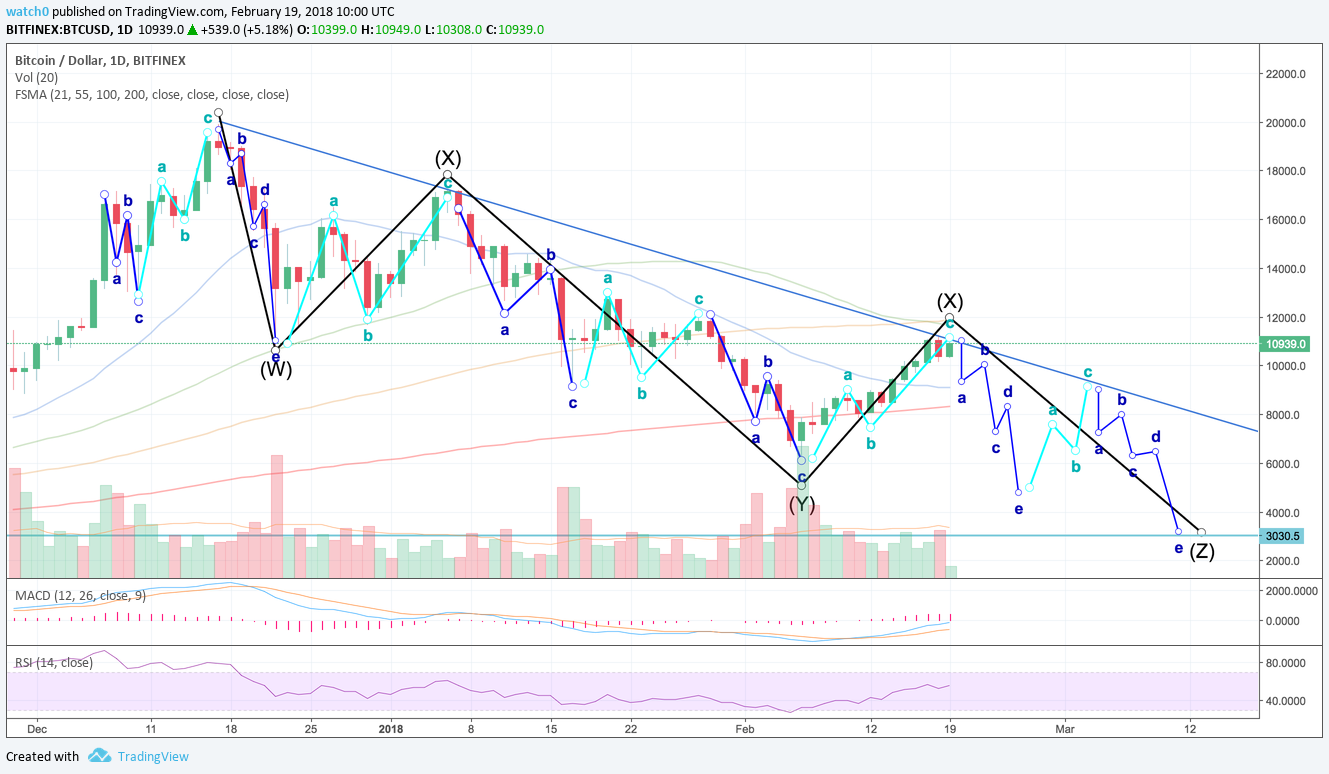
Is Bitcoin done with it’s correction? No one really knows, but we can use Elliot Wave Principle to make some predictions. With strong correlation to corrective waves past observed, we can make some conjectures. The BTC/Dollar chart below shows strikingly similar resemblence to the Triple Three correction.

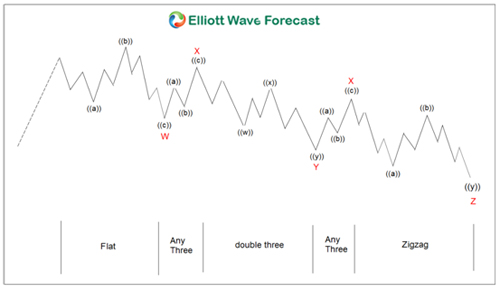
Here is the Triple Three corrective wave described by Elliot Wave Principle.
From Elliottwave Forecast
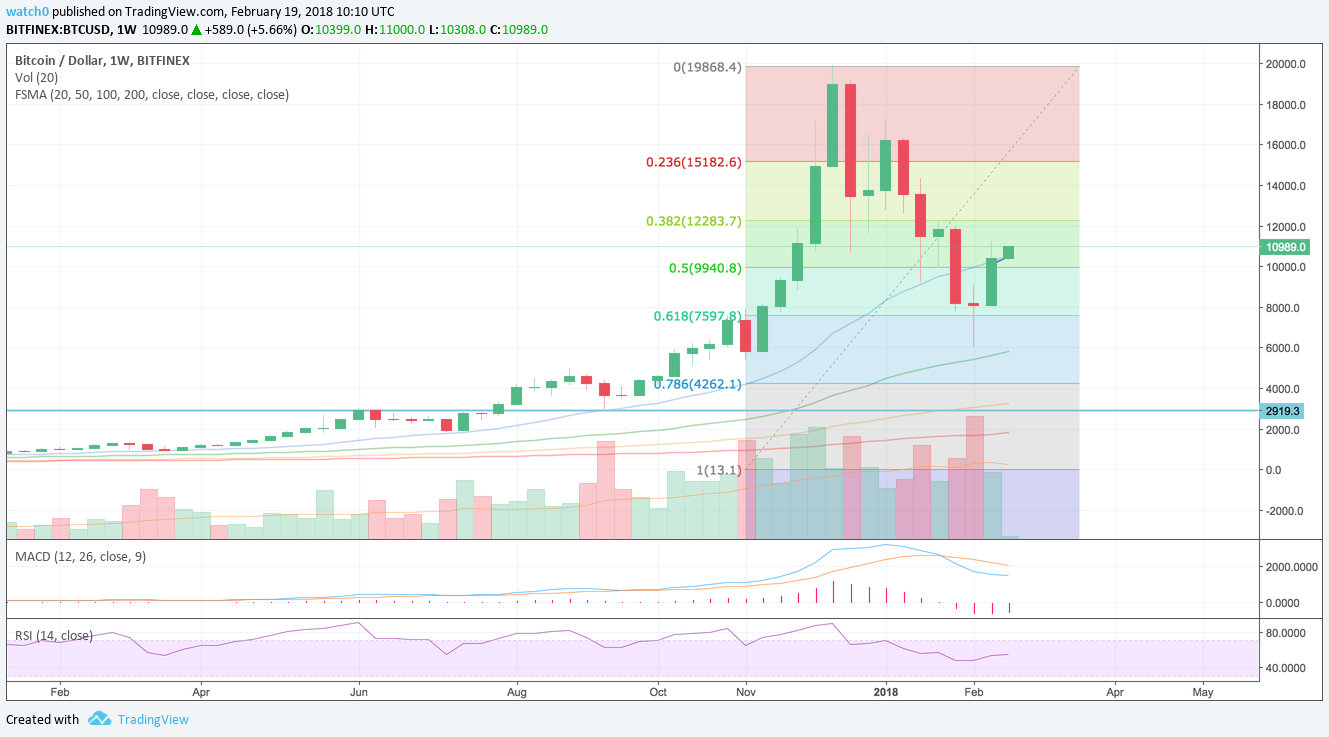
Go to a bigger weekly time frame and we can see that BTC got a significant bounce at the 0.618 Fib level. Typically the low will be retested for the market to confirm that the bottom has been put in. If it makes a lower low, then there is a high probability that BTC will go down further into the $4k range.

Here are the 3 major levels of support.
- Double bottom @ ~$6k
- 0.786 Fib level @ ~$4k
- 100 Weekly SMA @ ~$3k
*Legal Disclaimer: I am not a financial advisor nor is any content in this article presented as financial advice. The information provided in this blog post and any other posts that I make and any accompanying material is for informational purposes only. It shoud not be considered financial or investment advice of any kind. One should consult with a financial or investment professional to determine what may be best for your individual needs. It’s only meant for use as informative or entertainment purposes.

