Bitcoin - failed breakout, further downside
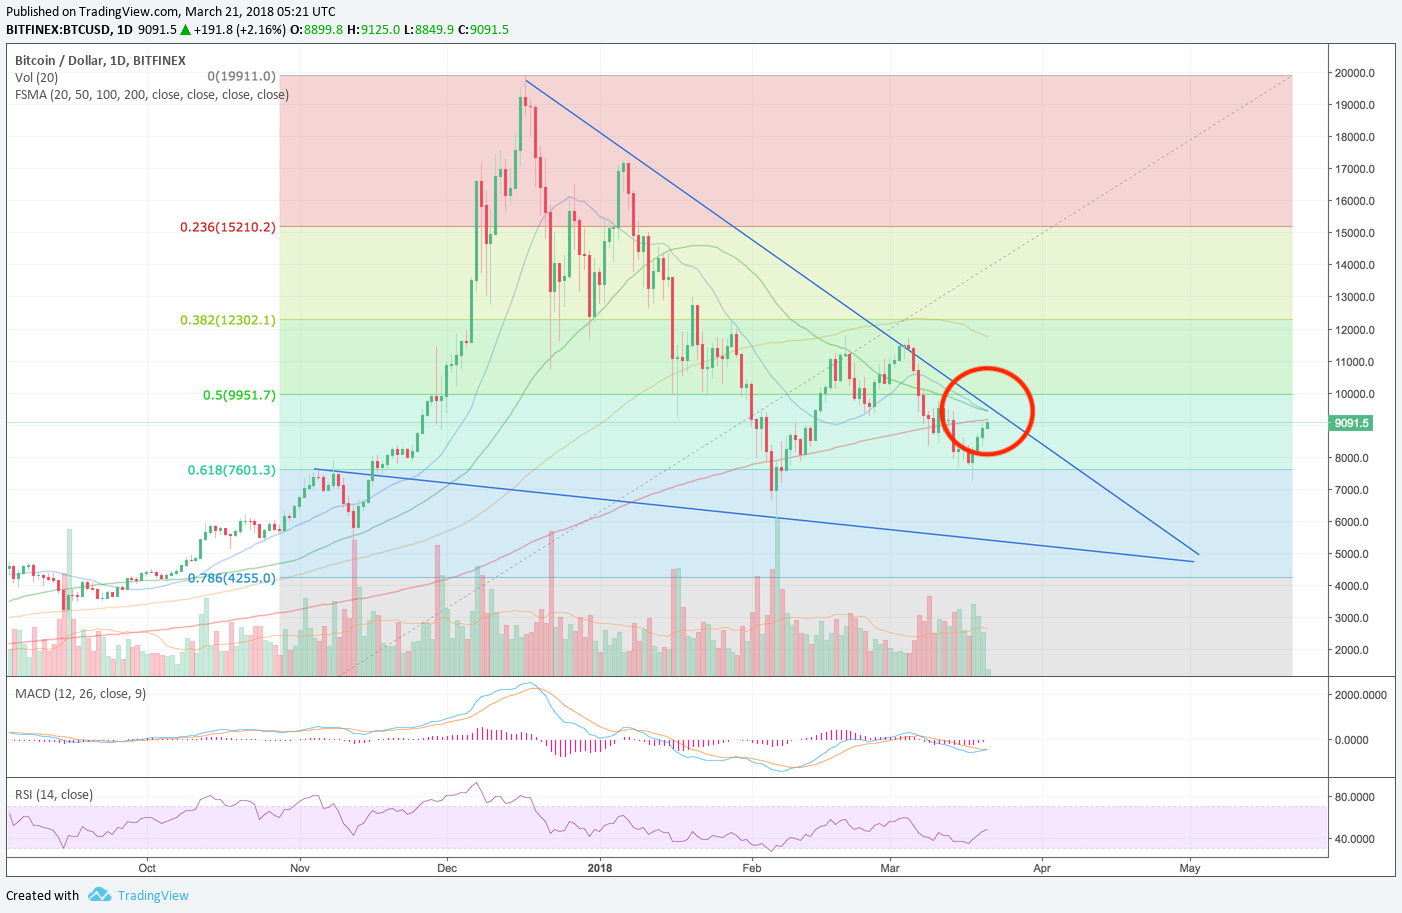
Where is bitcoin headed? Observing the recent price action, bitcoin has more downside action, and will probably last at least couple more months. Elliot wave analysis also shows that it is likely that we’ll head down to a fib retracement of between 76.4 ~ 85.4% to around $3 ~ $4k. Coincidentally, this is a retracement back to the levels that bitcoin was at when Jamie Dimon was bashing on bitcoin back in September 2017.
Price Rejection
Bitcoin didn’t have enough momentum to break out of the upper trend line, and it was rejected pretty hard. Now it is hovering just under moving averages and waiting for the death cross to occur. There is high a probability that bitcoin will see a sharp sell off when the cross over occurs.

Upon rejection around 9k, the price is projected to head down. The previous low @ ~6k probably won’t hold and will make a lower low and bounce around within the descending wedge.
- Temporary support @ ~5.5k
- Final low @ 3 ~ 4k
We’ll see capitulation sell volume greater than that of when price came down to ~6k.
Log Scale View
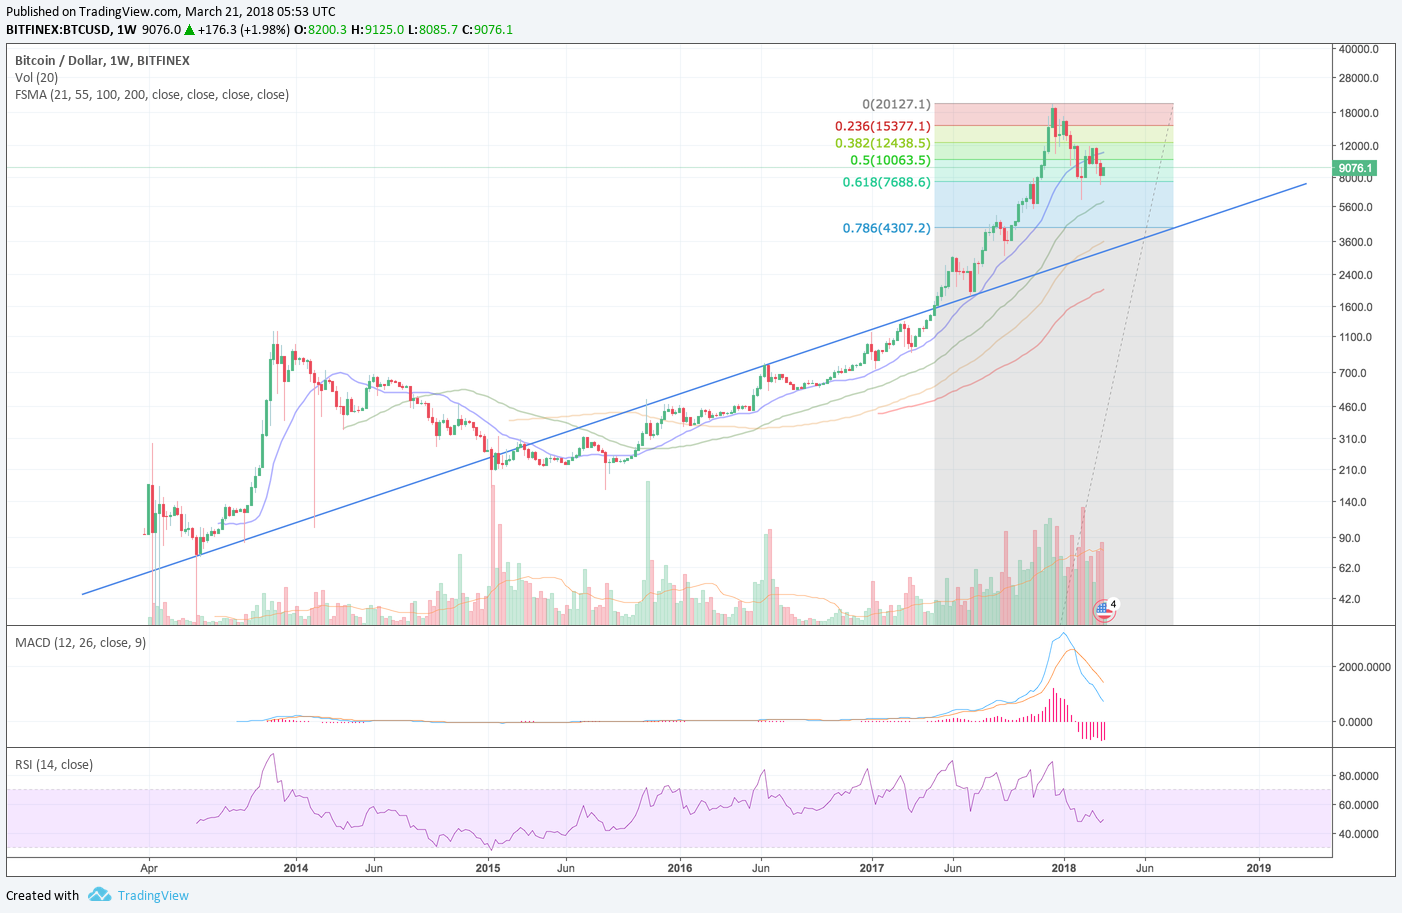
Another way to look at the corrective path bitcoin is taking is to look at the chart in log scale.

The cup has already formed and price is working on the handle. By drawing a line that best describes the general trend, we can come up with an educated guess on where price needs to head in order to form a good handle that will catapult the price upwards in a violent manner. Forming a good handle will ensure that bitcoin will have enough momentum to start another bull run.
Even if bitcoin falls to 3k today, we’re still above the ascending trendline and the macro bull run can continue.
The actual bottom for bitcoin will depend on how quickly the fear sets in to create the perfect storm for a crash. With each lower low, the faster the selling will occur. The best way to buy in at the lows is to cast multiple ladders and use the dollar-cost averaging technique.
Elliot Wave Analysis - Wave 2 or 4?
From looking at the log chart, you might say wave 4, but bitcoin is actually on wave 2. Consider the Fibonacci Ratio Relationship 1
- Wave 2 is 50%, 61.8%, 76.4%, or 85.4% of wave 1
- Wave 3 is 161.8%, 200%, 261.8%, or 323.6% of wave 1-2
- Wave 4 is 14.6%, 23.6%, or 38.2% of wave 3 but no more than 50%
- There are three different ways to measure wave 5. First, wave 5 is inverse 123.6 – 161.8% retracement of wave 4. Second, wave 5 is equal to wave 1. Third, wave 5 is 61.8% of wave 1-3
The current corrective trend has already retraced past 50%, which is the maximum retracement for wave 4. Having retrace past 61.8%, we’re on wave 2. Wave 2 is notorious for a long and steep pull back. 85.4% retracement at right around 3k. If we happen to decisively retrace below this level, then… Houston, we have a problem. Panic is the right emotion to let in at that moment.
I remember last year in September 2017 when Jamie Dimon was bashing on bitcoin and it sold off to around 3k. There were also rumors that JP Morgan bought a bunch of bitcoin and soon after went on a bull run to 20k. Is it a coincidence that bitcoin will retrace 85.4% to around 3k?
*Legal Disclaimer: I am not a financial advisor nor is any content in this article presented as financial advice. The information provided in this blog post and any other posts that I make and any accompanying material is for informational purposes only. It shoud not be considered financial or investment advice of any kind. One should consult with a financial or investment professional to determine what may be best for your individual needs. It’s only meant for use as informative or entertainment purposes.
-
https://elliottwave-forecast.com/elliott-wave-theory ↩
